Alliant Energy EPRI: Electric Power Research Institute
Madison Solar Demonstration Project

Site Settings

Slideshow Speed: Home Page and Image Gallery
Automatically advance to the next image:
Tip: pause a slideshow by clicking or advancing images manually.

Alternate Display Modes

Full Screen Mode
When using a desktop or laptop computer, you may be able to toggle full screen mode. Chrome, Firefox, and Internet Explorer: press [F11]. Edge: press [Shift]+[Windows key]+[Enter]. Safari: press [Control]+[Command]+[F]. Your browser may also have a menu option to enter full screen mode.
Billboard Mode
Entering this mode will automate the entire website, advancing through a predefined set of pages at specific time intervals. This mode is intended for kiosks or displays where user interaction is prohibited or not feasible. Do not use billboard mode with smartphones or tablets. Click here to enter billboard mode.

Contact Us

Contact Alliant Energy

For information about Alliant Energy or this project, call 1-800-ALLIANT (1-800-255-4268). Please contact EPRI for website support.

Contact EPRI

For website support or for information about EPRI or this project, call 1-650-855-2121, email askepri@epri.com or submit a form to contact EPRI's Customer Assistance Specialists.

About this website

This website was designed and developed by EPRI in collaboration with Alliant Energy, EPRI's Integration of Distributed Energy Resources and Solar programs, and EPRI's Power Delivery and Generation sectors.

Help: information about this page...

Component Group View

This view presents a grouping of related components. Try interacting with the comparison chart on this page. Select a component tile to explore further.

Panels

This page contains several panels: Performance Snapshot, Overview, etc. Tap or click the "?" button in the upper right corner of a panel to see more information about its content.
PV Array Orientations

Component View | Aggregate View
Performance Snapshot

This panel may show a sampled measurement (e.g., power) and/or a cumulative measurement (e.g., energy generated).

When the sampled measurement is available, a gauge and trend chart will appear.

When the cumulative measurement is available, its value will be shown over the date range indicated.

Sampled Value (Gauge and Chart)

Power output (AC)

Cumulative Value

Cumulative energy generated

Power Output
Energy Generated
---
kWh
Power Output (kW)
Overview

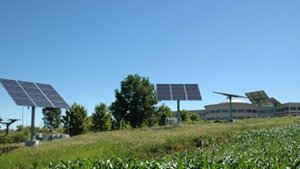
Located in the orientation lab, five PV arrays have been installed with distinct orientations and tracking methods: south-facing at 10° and 35° tilt, southeast- and southwest-facing at 35° tilt, and dual-axis tracking. Their combined PV array rating is about 15 kW, and each array is instrumented with a highly accurate (revenue-grade) power meter, sunlight sensors (silicon pyranometers), and temperature sensors.

Research Value

Side-by-side operation of a collection of PV arrays oriented in various directions enables researchers to conduct comparative analyses along many dimensions. Analysts are comparing actual solar energy production with predicted production and quantifying how the different PV array orientations and tracking methods simultaneously affect coincident power output and are affected by cloud-induced seasonal solar variability.

Components
Technology Tiles

Swipe or drag the row of tiles left and right or use the left/right "< >" arrows to see all available tiles.

Tap or click a tile to view more information and data.

Gauges show sampled measurements associated with each tile.

Time Series Comparison

Chart (or charts) shows trends among comparable components. Each data point represents an aggregated value for the time interval indicated (e.g., 15-minute average).

Chart Navigation

Tap or click on the chart titles (if more than one shown) to switch the view between charts. The title of the displayed chart is highlighted in orange.

Zoom and Pan

To zoom in on and get a closer view of a plot area in a chart:

  • On a touchscreen: Use two fingers to spread apart (expand) the plot area, then use one finger to slide the plot area left and right.
  • Using a mouse: Click and drag to select a section of the plot area, then hold down the Shift key while dragging left and right.
  • Tap or click on the "Reset zoom" button to return the chart to its original size.

Toggle Legend Items

Tap or click on a legend item (if more than one shown) to hide or show its data in the plot area.

Components Defined

These components appear in at least one chart (indicated in the legend):

  • South-10: Fixed-Tilt Array: South 10°
  • Southeast-35: Fixed-Tilt Array: Southeast 35°
  • South-35: Fixed-Tilt Array: South 35°
  • Southwest-35: Fixed-Tilt Array: Southwest 35°
  • Dual-Axis: Dual-Axis Tracking Array
  • Single-Axis: Single-Axis Tracking Array
Measurements Plotted

Chart (or charts) includes one or more of the following measurements (indicated in the legend or title):

  • Power output (AC)
  • Plane-of-array irradiance
  • Back surface temperature of PV module

Preset Date Ranges


Custom Date Range

to
Data are available from 4/1/2016 through 7/26/2020. Clear the end date to view the most recent data available.
Tip: click "?" (next to the Edit button) to learn how to interact with the chart.

Download Chart Data

Save chart data as a comma-separated values (CSV) file:
Note: timestamps (first column in the CSV file) are adjusted to your computer's time zone and represent the beginning of each interval.
Warning: downloading data is intended for desktop and laptop computers. This feature may not work for smartphones or tablets.
POWER OUTPUT
PLANE-OF-ARRAY IRRADIANCE
PV MODULE TEMPERATURE
Daily Comparison
Daily Comparison

Chart (or charts) shows trends among comparable components. Each data point represents an aggregated value for the date indicated.

Chart Navigation

Tap or click on the chart titles (if more than one shown) to switch the view between charts. The title of the displayed chart is highlighted in orange.

Zoom and Pan

To zoom in on and get a closer view of a plot area in a chart:

  • On a touchscreen: Use two fingers to spread apart (expand) the plot area, then use one finger to slide the plot area left and right.
  • Using a mouse: Click and drag to select a section of the plot area, then hold down the Shift key while dragging left and right.
  • Tap or click on the "Reset zoom" button to return the chart to its original size.

Toggle Legend Items

Tap or click on a legend item (if more than one shown) to hide or show its data in the plot area.

Components Defined

These components appear in at least one chart (indicated in the legend):

  • South-10: Fixed-Tilt Array: South 10°
  • Southeast-35: Fixed-Tilt Array: Southeast 35°
  • South-35: Fixed-Tilt Array: South 35°
  • Southwest-35: Fixed-Tilt Array: Southwest 35°
  • Dual-Axis: Dual-Axis Tracking Array
  • Single-Axis: Single-Axis Tracking Array
Measurements Plotted

Chart (or charts) includes one or more of the following measurements (indicated in the legend or title):

  • Cumulative net energy generated (energy generated minus energy consumed)
  • Plane-of-array irradiance
  • Back surface temperature of PV module

Preset Date Ranges


Custom Date Range

to
Data are available from 4/1/2016 through 7/26/2020. Clear the end date to view the most recent data available.
Tip: click "?" (next to the Edit button) to learn how to interact with the chart.

Download Chart Data

Save chart data as a comma-separated values (CSV) file:
Note: dates (first column in the CSV file) are based on the site's geographic location, which may be different from your computer's time zone.
Warning: downloading data is intended for desktop and laptop computers. This feature may not work for smartphones or tablets.
CUMULATIVE NET ENERGY GENERATED
PLANE-OF-ARRAY IRRADIANCE
PV MODULE TEMPERATURE
Monthly Comparison
Monthly Comparison

Chart (or charts) shows trends among comparable components. Each data point represents an aggregated value for the month indicated.

Chart Navigation

Tap or click on the chart titles (if more than one shown) to switch the view between charts. The title of the displayed chart is highlighted in orange.

Zoom and Pan

To zoom in on and get a closer view of a plot area in a chart:

  • On a touchscreen: Use two fingers to spread apart (expand) the plot area, then use one finger to slide the plot area left and right.
  • Using a mouse: Click and drag to select a section of the plot area, then hold down the Shift key while dragging left and right.
  • Tap or click on the "Reset zoom" button to return the chart to its original size.

Toggle Legend Items

Tap or click on a legend item (if more than one shown) to hide or show its data in the plot area.

Components Defined

These components appear in at least one chart (indicated in the legend):

  • South-10: Fixed-Tilt Array: South 10°
  • Southeast-35: Fixed-Tilt Array: Southeast 35°
  • South-35: Fixed-Tilt Array: South 35°
  • Southwest-35: Fixed-Tilt Array: Southwest 35°
  • Dual-Axis: Dual-Axis Tracking Array
  • Single-Axis: Single-Axis Tracking Array
Measurements Plotted

Chart (or charts) includes one or more of the following measurements (indicated in the legend or title):

  • Cumulative net energy generated (energy generated minus energy consumed)
  • Plane-of-array irradiance
  • Back surface temperature of PV module

Preset Date Ranges


Custom Date Range

to
Data are available from 4/1/2016 through 7/26/2020. Clear the end date to view the most recent data available.
Tip: click "?" (next to the Edit button) to learn how to interact with the chart.

Download Chart Data

Save chart data as a comma-separated values (CSV) file:
Note: dates (first column in the CSV file) are based on the site's geographic location, which may be different from your computer's time zone.
Warning: downloading data is intended for desktop and laptop computers. This feature may not work for smartphones or tablets.
CUMULATIVE NET ENERGY GENERATED
PLANE-OF-ARRAY IRRADIANCE
PV MODULE TEMPERATURE
Cumulative Comparison

Chart (or charts) shows an aggregated value for the entire date range indicated.

Chart Navigation

Tap or click on the chart titles (if more than one shown) to switch the view between charts. The title of the displayed chart is highlighted in orange.

Zoom and Pan

To zoom in on and get a closer view of a plot area in a chart:

  • On a touchscreen: Use two fingers to spread apart (expand) the plot area, then use one finger to slide the plot area left and right.
  • Using a mouse: Click and drag to select a section of the plot area, then hold down the Shift key while dragging left and right.
  • Tap or click on the "Reset zoom" button to return the chart to its original size.

Toggle Legend Items

Tap or click on a legend item (if more than one shown) to hide or show its data in the plot area.

Components Defined

These components appear in at least one chart (indicated in the legend):

  • South-10: Fixed-Tilt Array: South 10°
  • Southeast-35: Fixed-Tilt Array: Southeast 35°
  • South-35: Fixed-Tilt Array: South 35°
  • Southwest-35: Fixed-Tilt Array: Southwest 35°
  • Dual-Axis: Dual-Axis Tracking Array
  • Single-Axis: Single-Axis Tracking Array
Measurements Plotted

Chart (or charts) includes one or more of the following measurements (indicated in the legend or title):

  • Cumulative net energy generated (energy generated minus energy consumed)

Preset Date Ranges


Custom Date Range

to
Data are available from 4/1/2016 through 7/26/2020. Clear the end date to view the most recent data available.
Tip: click "?" (next to the Edit button) to learn how to interact with the chart.

Download Chart Data

Save chart data as a comma-separated values (CSV) file:
Note: timestamps (first column in the CSV file) are adjusted to your computer's time zone and represent the beginning of each interval.
Warning: downloading data is intended for desktop and laptop computers. This feature may not work for smartphones or tablets.
CUMULATIVE NET ENERGY GENERATED
Image for PV Array Orientations