This panel may show a sampled measurement (e.g., power) and/or a cumulative measurement (e.g., energy generated).
When the sampled measurement is available, a gauge and trend chart will appear.
When the cumulative measurement is available, its value will be shown over the date range indicated.
Feels like (apparent) temperature represents wind chill or heat index; depends on air temperature, relative humidity, and wind speed
Feels Like Temperature
|
|
Feels Like Temperature (°F)
|
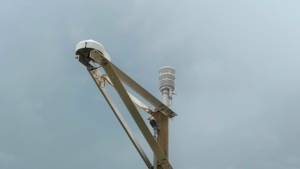
Weather stations are used to evaluate the effects of various weather conditions on the performance of solar (PV) technologies. Depending on the climate and surroundings of a PV array, environmental factors can have a considerable effect on the solar power generated.
Chart (or charts) shows trends for a specific component. Each data point represents an aggregated value for the time interval indicated (e.g., 15-minute average).
Tap or click on the chart titles (if more than one shown) to switch the view between charts. The title of the displayed chart is highlighted in orange.
To zoom in on and get a closer view of a plot area in a chart:
Tap or click on a legend item (if more than one shown) to hide or show its data in the plot area.
Chart (or charts) includes one or more of the following measurements (indicated in the legend or title):
Chart (or charts) shows trends for a specific component. Each data point represents an aggregated value for the date indicated.
Tap or click on the chart titles (if more than one shown) to switch the view between charts. The title of the displayed chart is highlighted in orange.
To zoom in on and get a closer view of a plot area in a chart:
Tap or click on a legend item (if more than one shown) to hide or show its data in the plot area.
Chart (or charts) shows trends for a specific component. Each data point represents an aggregated value for the month indicated.
Tap or click on the chart titles (if more than one shown) to switch the view between charts. The title of the displayed chart is highlighted in orange.
To zoom in on and get a closer view of a plot area in a chart:
Tap or click on a legend item (if more than one shown) to hide or show its data in the plot area.