This panel may show a sampled measurement (e.g., power) and/or a cumulative measurement (e.g., energy generated).
When the sampled measurement is available, a gauge and trend chart will appear.
When the cumulative measurement is available, its value will be shown over the date range indicated.
AC power
AC Power
|
|
AC Power (kW)
|
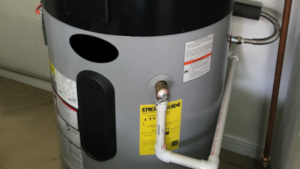
This water heater provides hot water for House 2. The water heater has electric elements and a small heat pump to reheat water quickly and/or efficiently based on water usage demand. The water heater's temperature setting can be controlled remotely, which is useful to optimize power consumption while leveraging the thermal energy stored in the water tank.
Chart (or charts) shows trends for a specific component. Each data point represents an aggregated value for the time interval indicated (e.g., 15-minute average).
Tap or click on the chart titles (if more than one shown) to switch the view between charts. The title of the displayed chart is highlighted in orange.
To zoom in on and get a closer view of a plot area in a chart:
Tap or click on a legend item (if more than one shown) to hide or show its data in the plot area.
Chart (or charts) includes one or more of the following measurements (indicated in the legend or title):
Chart (or charts) shows trends for a specific component. Each data point represents an aggregated value for the date indicated.
Tap or click on the chart titles (if more than one shown) to switch the view between charts. The title of the displayed chart is highlighted in orange.
To zoom in on and get a closer view of a plot area in a chart:
Tap or click on a legend item (if more than one shown) to hide or show its data in the plot area.
Chart (or charts) shows trends for a specific component. Each data point represents an aggregated value for the month indicated.
Tap or click on the chart titles (if more than one shown) to switch the view between charts. The title of the displayed chart is highlighted in orange.
To zoom in on and get a closer view of a plot area in a chart:
Tap or click on a legend item (if more than one shown) to hide or show its data in the plot area.