EPRI: Electric Power Research Institute
Southeastern Solar Research Center

Site Settings

Slideshow Speed: Home Page and Image Gallery
Automatically advance to the next image:
Tip: pause a slideshow by clicking or advancing images manually.

Alternate Display Modes

Full Screen Mode
When using a desktop or laptop computer, you may be able to toggle full screen mode. Chrome, Firefox, and Internet Explorer: press [F11]. Edge: press [Shift]+[Windows key]+[Enter]. Safari: press [Control]+[Command]+[F]. Your browser may also have a menu option to enter full screen mode.
Billboard Mode
Entering this mode will automate the entire website, advancing through a predefined set of pages at specific time intervals. This mode is intended for kiosks or displays where user interaction is prohibited or not feasible. Do not use billboard mode with smartphones or tablets. Click here to enter billboard mode.

Contact Us

Contact EPRI

For website support or for information about EPRI or this project, call 1-650-855-2121, email askepri@epri.com or submit a form to contact EPRI's Customer Assistance Specialists.

About this website

This website was designed and developed by EPRI in collaboration with Southern Company, other member utility companies, and EPRI's Renewable Generation program.

Help: information about this page...

Component View

After reading the overview, try interacting with the comparison chart(s) to learn more about the data's characteristics and trends.

Panels

This page contains several panels: Performance Snapshot, Overview, etc. Tap or click the "?" button in the upper right corner of a panel to see more information about its content.

Solar Radiation Station

Aggregate View | Component View
Performance Snapshot

This panel may show a sampled measurement (e.g., power) and/or a cumulative measurement (e.g., energy generated).

When the sampled measurement is available, a gauge and trend chart will appear.

When the cumulative measurement is available, its value will be shown over the date range indicated.

Sampled Value (Gauge and Chart)

Total sky irradiance (sum of direct normal irradiance and direct horizontal irradiance)

Total Sky Irradiance
Total Sky Irradiance (W/m²)
Overview

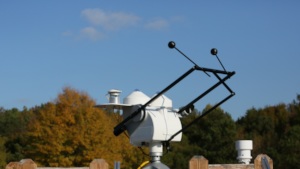
Key solar radiation components are commonly used when evaluating solar resource at a particular location:

  • direct normal irradiance (DNI)
  • diffuse horizontal irradiance (DHI)
  • global horizontal irradiance (GHI)
  • plane-of-array irradiance (POA)*

(*Plane-of-array irradiance represents the amount of sunlight that reaches a solar array. Global tilted irradiance (GTI) may be substituted for plane-of-array irradiance if assumptions are made about a solar array's tilt and orientation.)

Research Value

Solar radiation is an important measurement used to determine both operational performance of photovoltaic (PV) plants and expected performance when siting and designing new PV plants. Generally, a PV plant’s power generation is proportional to solar radiation received by the plant’s PV arrays. When measured properly, on-site solar radiation data can be used to quantify a PV plant’s exposure to sunlight and establish a robust baseline solar resource dataset.

Typical Values

Two common terms are used to describe solar radiation: irradiance and insolation.

  • Irradiance is the rate sunlight is received on a given surface, measured in watts per square meter (W/m²). Typical values range from 0 (nighttime) to 1,000 (direct sunlight), and irradiance may exceed 1,200 to 1,400 W/m² for short durations under certain cloud-enhancement conditions.
  • Insolation represents solar radiation received over time and is an energy-based metric. Insolation is calculated from the integration of irradiance during daytime, and it is often reported as a daily value. Typical values range from 1 to 8 kWh/m²/day for fixed-tilt arrays, and daily insolation may approach 12 kWh/m²/day for dual-axis tracking arrays. Climate, weather, season, and array design affect insolation levels for a given geographic location.
Time Series Profile
Time Series Profile

Chart (or charts) shows trends for a specific component. Each data point represents an aggregated value for the time interval indicated (e.g., 15-minute average).

Chart Navigation

Tap or click on the chart titles (if more than one shown) to switch the view between charts. The title of the displayed chart is highlighted in orange.

Zoom and Pan

To zoom in on and get a closer view of a plot area in a chart:

  • On a touchscreen: Use two fingers to spread apart (expand) the plot area, then use one finger to slide the plot area left and right.
  • Using a mouse: Click and drag to select a section of the plot area, then hold down the Shift key while dragging left and right.
  • Tap or click on the "Reset zoom" button to return the chart to its original size.

Toggle Legend Items

Tap or click on a legend item (if more than one shown) to hide or show its data in the plot area.

Daily Performance
Daily Performance

Chart (or charts) shows trends for a specific component. Each data point represents an aggregated value for the date indicated.

Chart Navigation

Tap or click on the chart titles (if more than one shown) to switch the view between charts. The title of the displayed chart is highlighted in orange.

Zoom and Pan

To zoom in on and get a closer view of a plot area in a chart:

  • On a touchscreen: Use two fingers to spread apart (expand) the plot area, then use one finger to slide the plot area left and right.
  • Using a mouse: Click and drag to select a section of the plot area, then hold down the Shift key while dragging left and right.
  • Tap or click on the "Reset zoom" button to return the chart to its original size.

Toggle Legend Items

Tap or click on a legend item (if more than one shown) to hide or show its data in the plot area.

Monthly Performance
Monthly Performance

Chart (or charts) shows trends for a specific component. Each data point represents an aggregated value for the month indicated.

Chart Navigation

Tap or click on the chart titles (if more than one shown) to switch the view between charts. The title of the displayed chart is highlighted in orange.

Zoom and Pan

To zoom in on and get a closer view of a plot area in a chart:

  • On a touchscreen: Use two fingers to spread apart (expand) the plot area, then use one finger to slide the plot area left and right.
  • Using a mouse: Click and drag to select a section of the plot area, then hold down the Shift key while dragging left and right.
  • Tap or click on the "Reset zoom" button to return the chart to its original size.

Toggle Legend Items

Tap or click on a legend item (if more than one shown) to hide or show its data in the plot area.

Image for Solar Radiation Station