This panel may show a sampled measurement (e.g., power) and/or a cumulative measurement (e.g., energy generated).
When the sampled measurement is available, a gauge and trend chart will appear.
When the cumulative measurement is available, its value will be shown over the date range indicated.
Direct normal irradiance
Direct Normal Irradiance
|
|
Direct Normal Irradiance (W/m²)
|
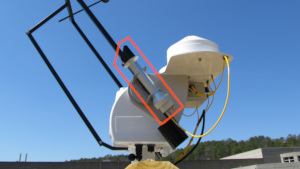
Direct normal irradiance passes in a straight line from the sun to the observer. Imagine looking directly at the sun through a tube with a 5° field of view. The tube blocks all other sources of light, allowing measurement of the sun’s direct radiation. The exclusion of solar radiation outside the tube, such as light reflected by the sky and surrounding environment, is the main quality that differentiates direct normal from other solar radiation components.
A pyrheliometer is employed to measure direct normal irradiance. Similar to the tube example above, a pyrheliometer has the appearance of a small telescope. The pyrheliometer must be mounted to a tracking system that keeps the sensor pointed at the sun, enabling measurement of direct sunlight at all times.
Chart (or charts) shows trends for a specific component. Each data point represents an aggregated value for the time interval indicated (e.g., 15-minute average).
Tap or click on the chart titles (if more than one shown) to switch the view between charts. The title of the displayed chart is highlighted in orange.
To zoom in on and get a closer view of a plot area in a chart:
Tap or click on a legend item (if more than one shown) to hide or show its data in the plot area.
Chart (or charts) includes one or more of the following measurements (indicated in the legend or title):
Chart (or charts) shows trends for a specific component. Each data point represents an aggregated value for the date indicated.
Tap or click on the chart titles (if more than one shown) to switch the view between charts. The title of the displayed chart is highlighted in orange.
To zoom in on and get a closer view of a plot area in a chart:
Tap or click on a legend item (if more than one shown) to hide or show its data in the plot area.
Chart (or charts) includes one or more of the following measurements (indicated in the legend or title):
Chart (or charts) shows trends for a specific component. Each data point represents an aggregated value for the month indicated.
Tap or click on the chart titles (if more than one shown) to switch the view between charts. The title of the displayed chart is highlighted in orange.
To zoom in on and get a closer view of a plot area in a chart:
Tap or click on a legend item (if more than one shown) to hide or show its data in the plot area.
Chart (or charts) includes one or more of the following measurements (indicated in the legend or title):