TVA EPRI: Electric Power Research Institute
Melton Hill Dam Sustainable Recreation Area

Site Settings

Slideshow Speed: Home Page and Image Gallery
Automatically advance to the next image:
Tip: pause a slideshow by clicking or advancing images manually.

Alternate Display Modes

Full Screen Mode
When using a desktop or laptop computer, you may be able to toggle full screen mode. Chrome, Firefox, and Internet Explorer: press [F11]. Edge: press [Shift]+[Windows key]+[Enter]. Safari: press [Control]+[Command]+[F]. Your browser may also have a menu option to enter full screen mode.
Billboard Mode
Entering this mode will automate the entire website, advancing through a predefined set of pages at specific time intervals. This mode is intended for kiosks or displays where user interaction is prohibited or not feasible. Do not use billboard mode with smartphones or tablets. Click here to enter billboard mode.

Contact Us

Contact TVA

For information about TVA or this project, please contact TVA's Public Land Information Center: email plic@tva.gov or call 800-882-5263. Please contact EPRI for website support.

Contact EPRI

For website support or for information about EPRI or this project, call 1-650-855-2121, email askepri@epri.com or submit a form to contact EPRI's Customer Assistance Specialists.

About this website

This website was designed and developed by EPRI in collaboration with TVA and EPRI's Integration of Distributed Energy Resources program.

Help: information about this page...

Component View

After reading the overview, try interacting with the comparison chart(s) to learn more about the data's characteristics and trends.

Panels

This page contains several panels: Performance Snapshot, Overview, etc. Tap or click the "?" button in the upper right corner of a panel to see more information about its content.
Pavilion Solar Arrays

Aggregate View | Component View
Performance Snapshot

This panel may show a sampled measurement (e.g., power) and/or a cumulative measurement (e.g., energy generated).

When the sampled measurement is available, a gauge and trend chart will appear.

When the cumulative measurement is available, its value will be shown over the date range indicated.

Sampled Value (Gauge and Chart)

AC power

Cumulative Value

Cumulative net energy generated (energy generated minus energy consumed)

AC Power
Net Energy Generated
---
kWh
AC Power (kW)
Overview

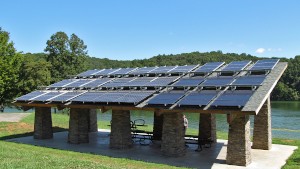
Located at the waterfront (swim beach) area, six solar arrays have been installed with various photovoltaic materials: monocrystalline & polycrystalline silicon, amorphous silicon, and copper indium gallium selenide (CIGS).

Their combined PV array rating is about 12.4 kW, and each array is instrumented with a revenue-grade power meter. Sunlight sensors (pyranometers) and temperature sensors are mounted on the pavilion roof to collect environmental data, too.

Research Value

Operating a collection of PV module technologies side-by-side in the field enables researchers to make comparative analyses. Analysts are comparing actual solar energy production and are quantifying how the different PV module technologies affect power output and are affected by cloud-induced seasonal solar variability.

Time Series Profile
Time Series Profile

Chart (or charts) shows trends for a specific component. Each data point represents an aggregated value for the time interval indicated (e.g., 15-minute average).

Chart Navigation

Tap or click on the chart titles (if more than one shown) to switch the view between charts. The title of the displayed chart is highlighted in orange.

Zoom and Pan

To zoom in on and get a closer view of a plot area in a chart:

  • On a touchscreen: Use two fingers to spread apart (expand) the plot area, then use one finger to slide the plot area left and right.
  • Using a mouse: Click and drag to select a section of the plot area, then hold down the Shift key while dragging left and right.
  • Tap or click on the "Reset zoom" button to return the chart to its original size.

Toggle Legend Items

Tap or click on a legend item (if more than one shown) to hide or show its data in the plot area.

Measurements Plotted

Chart (or charts) includes one or more of the following measurements (indicated in the legend or title):

  • AC power

Preset Date Ranges


Custom Date Range

to
Data are available beginning 1/1/2012. Clear the end date to view the most recent data available.
Tip: click "?" (next to the Edit button) to learn how to interact with the chart.

Download Chart Data

Save chart data as a comma-separated values (CSV) file:
Note: timestamps (first column in the CSV file) are adjusted to your computer's time zone and represent the beginning of each interval.
Warning: downloading data is intended for desktop and laptop computers. This feature may not work for smartphones or tablets.
AC POWER
Daily Performance
Daily Performance

Chart (or charts) shows trends for a specific component. Each data point represents an aggregated value for the date indicated.

Chart Navigation

Tap or click on the chart titles (if more than one shown) to switch the view between charts. The title of the displayed chart is highlighted in orange.

Zoom and Pan

To zoom in on and get a closer view of a plot area in a chart:

  • On a touchscreen: Use two fingers to spread apart (expand) the plot area, then use one finger to slide the plot area left and right.
  • Using a mouse: Click and drag to select a section of the plot area, then hold down the Shift key while dragging left and right.
  • Tap or click on the "Reset zoom" button to return the chart to its original size.

Toggle Legend Items

Tap or click on a legend item (if more than one shown) to hide or show its data in the plot area.

Measurements Plotted

Chart (or charts) includes one or more of the following measurements (indicated in the legend or title):

  • Cumulative net energy generated (energy generated minus energy consumed)

Preset Date Ranges


Custom Date Range

to
Data are available beginning 1/1/2012. Clear the end date to view the most recent data available.
Tip: click "?" (next to the Edit button) to learn how to interact with the chart.

Download Chart Data

Save chart data as a comma-separated values (CSV) file:
Note: dates (first column in the CSV file) are based on the site's geographic location, which may be different from your computer's time zone.
Warning: downloading data is intended for desktop and laptop computers. This feature may not work for smartphones or tablets.
CUMULATIVE NET ENERGY GENERATED
Monthly Performance
Monthly Performance

Chart (or charts) shows trends for a specific component. Each data point represents an aggregated value for the month indicated.

Chart Navigation

Tap or click on the chart titles (if more than one shown) to switch the view between charts. The title of the displayed chart is highlighted in orange.

Zoom and Pan

To zoom in on and get a closer view of a plot area in a chart:

  • On a touchscreen: Use two fingers to spread apart (expand) the plot area, then use one finger to slide the plot area left and right.
  • Using a mouse: Click and drag to select a section of the plot area, then hold down the Shift key while dragging left and right.
  • Tap or click on the "Reset zoom" button to return the chart to its original size.

Toggle Legend Items

Tap or click on a legend item (if more than one shown) to hide or show its data in the plot area.

Measurements Plotted

Chart (or charts) includes one or more of the following measurements (indicated in the legend or title):

  • Cumulative net energy generated (energy generated minus energy consumed)

Preset Date Ranges


Custom Date Range

to
Data are available beginning 1/1/2012. Clear the end date to view the most recent data available.
Tip: click "?" (next to the Edit button) to learn how to interact with the chart.

Download Chart Data

Save chart data as a comma-separated values (CSV) file:
Note: dates (first column in the CSV file) are based on the site's geographic location, which may be different from your computer's time zone.
Warning: downloading data is intended for desktop and laptop computers. This feature may not work for smartphones or tablets.
CUMULATIVE NET ENERGY GENERATED
Cumulative Performance

Chart (or charts) shows aggregated values for the date range indicated.

Chart Navigation

Tap or click on the chart titles (if more than one shown) to switch the view between charts. The title of the displayed chart is highlighted in orange.

Zoom and Pan

To zoom in on and get a closer view of a plot area in a chart:

  • On a touchscreen: Use two fingers to spread apart (expand) the plot area, then use one finger to slide the plot area left and right.
  • Using a mouse: Click and drag to select a section of the plot area, then hold down the Shift key while dragging left and right.
  • Tap or click on the "Reset zoom" button to return the chart to its original size.

Toggle Legend Items

Tap or click on a legend item (if more than one shown) to hide or show its data in the plot area.

Measurements Plotted

Chart (or charts) includes one or more of the following measurements (indicated in the legend or title):

  • Cumulative net energy generated (energy generated minus energy consumed)

Preset Date Ranges


Custom Date Range

to
Data are available beginning 1/1/2012. Clear the end date to view the most recent data available.
Tip: click "?" (next to the Edit button) to learn how to interact with the chart.
CUMULATIVE NET ENERGY GENERATED
Image for Pavilion Solar Arrays