This panel may show a sampled measurement (e.g., power) and/or a cumulative measurement (e.g., energy generated).
When the sampled measurement is available, a gauge and trend chart will appear.
When the cumulative measurement is available, its value will be shown over the date range indicated.
Precipitation rate (rainfall and/or snowmelt)
Cumulative rainfall or snowmelt
Precipitation Rate
|
Precipitation
|
|
---
in
|
Precipitation Rate (in/h)
|
Precipitation levels can have either a positive or negative effect on PV power output, depending on the type of precipitation. For example, studies have shown that PV systems affected by soiling typically increase their power output after a rainfall, as the rain washes debris from the solar modules. This is why PV systems in regions with regular rainfall are typically less affected by soiling losses than are those in arid regions. In contrast to rain precipitation, snow has a negative effect on power output, as its accumulation blocks the solar arrays from receiving sunlight until the snow melts.
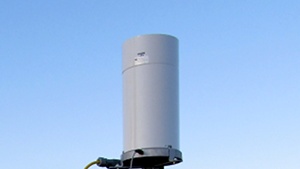
Precipitation levels are measured using a tipping-bucket rain gauge. The 8-inch diameter tipping-bucket measures cumulative rainfall. It also collects and melts frozen precipitation (snow or ice) then measures the amount of water - a technique that is not precise.
Chart (or charts) shows trends for a specific component. Each data point represents an aggregated value for the time interval indicated (e.g., 15-minute average).
Tap or click on the chart titles (if more than one shown) to switch the view between charts. The title of the displayed chart is highlighted in orange.
To zoom in on and get a closer view of a plot area in a chart:
Tap or click on a legend item (if more than one shown) to hide or show its data in the plot area.
Chart (or charts) includes one or more of the following measurements (indicated in the legend or title):
Chart (or charts) shows trends for a specific component. Each data point represents an aggregated value for the date indicated.
Tap or click on the chart titles (if more than one shown) to switch the view between charts. The title of the displayed chart is highlighted in orange.
To zoom in on and get a closer view of a plot area in a chart:
Tap or click on a legend item (if more than one shown) to hide or show its data in the plot area.
Chart (or charts) includes one or more of the following measurements (indicated in the legend or title):
Chart (or charts) shows trends for a specific component. Each data point represents an aggregated value for the month indicated.
Tap or click on the chart titles (if more than one shown) to switch the view between charts. The title of the displayed chart is highlighted in orange.
To zoom in on and get a closer view of a plot area in a chart:
Tap or click on a legend item (if more than one shown) to hide or show its data in the plot area.
Chart (or charts) includes one or more of the following measurements (indicated in the legend or title):
Chart (or charts) shows aggregated values for the date range indicated.
Tap or click on the chart titles (if more than one shown) to switch the view between charts. The title of the displayed chart is highlighted in orange.
To zoom in on and get a closer view of a plot area in a chart:
Tap or click on a legend item (if more than one shown) to hide or show its data in the plot area.
Chart (or charts) includes one or more of the following measurements (indicated in the legend or title):